Get Ready for the course
Please read this guide thoroughly before the course starts.
Software installation guide
Before the course starts please ensure that you have R and the following R packages
installed in order to run the exercises: pcalg,
causalDisco (development version), pdftools,
micd, dagitty, BiocManager,
devtools.
Some of these packages have non-standard installation requirements, and hence we suggest you follow our guidelines below.
First install these packages:
install.packages(c("BiocManager", "devtools", "pdftools", "dagitty"))Next, run this code to install further libraries from BioConductor:
BiocManager::install("graph")
BiocManager::install("RBGL")
BiocManager::install("Rgraphviz")
Then run this code to install two remaining packages:
install.packages(c("micd", "pcalg"))
devtools::install_github("annennenne/causalDisco")
We will use a LaTeX backend for plotting. If you do not have LaTeX installed already, you may install it from R using the tinytex package:
install.packages("tinytex")
library(tinytex)
install_tinytex()
Now you should be ready to go! You can check the most crucial installation steps by testing if this code runs and produces a plot:
library(causalDisco)
data(tpcExample)
res <- tpc(tpcExample, order = c("child", "youth", "oldage"))
tplot(res)
Introduction to directed acyclic graphs
If you are not familiar with directed acyclic graphs (DAGs), we suggest you read the following article: Digitale, J. C., Martin, J. N., & Glymour, M. M. (2022). Tutorial on directed acyclic graphs. Journal of Clinical Epidemiology, 142, 264-267.
If you want a more detailed introduction to causal graphical models and their use in epidemiology, we recommend the following source: Glymour, M. M., & Greenland, S. (2008). Causal diagrams. Modern epidemiology, 3. edition, 183-209.
Pre-course homework: contemplate a DAG
Homework before the course starts: Please see the following introductory document on DAG construction and an example dataset that we will use throughout the course.
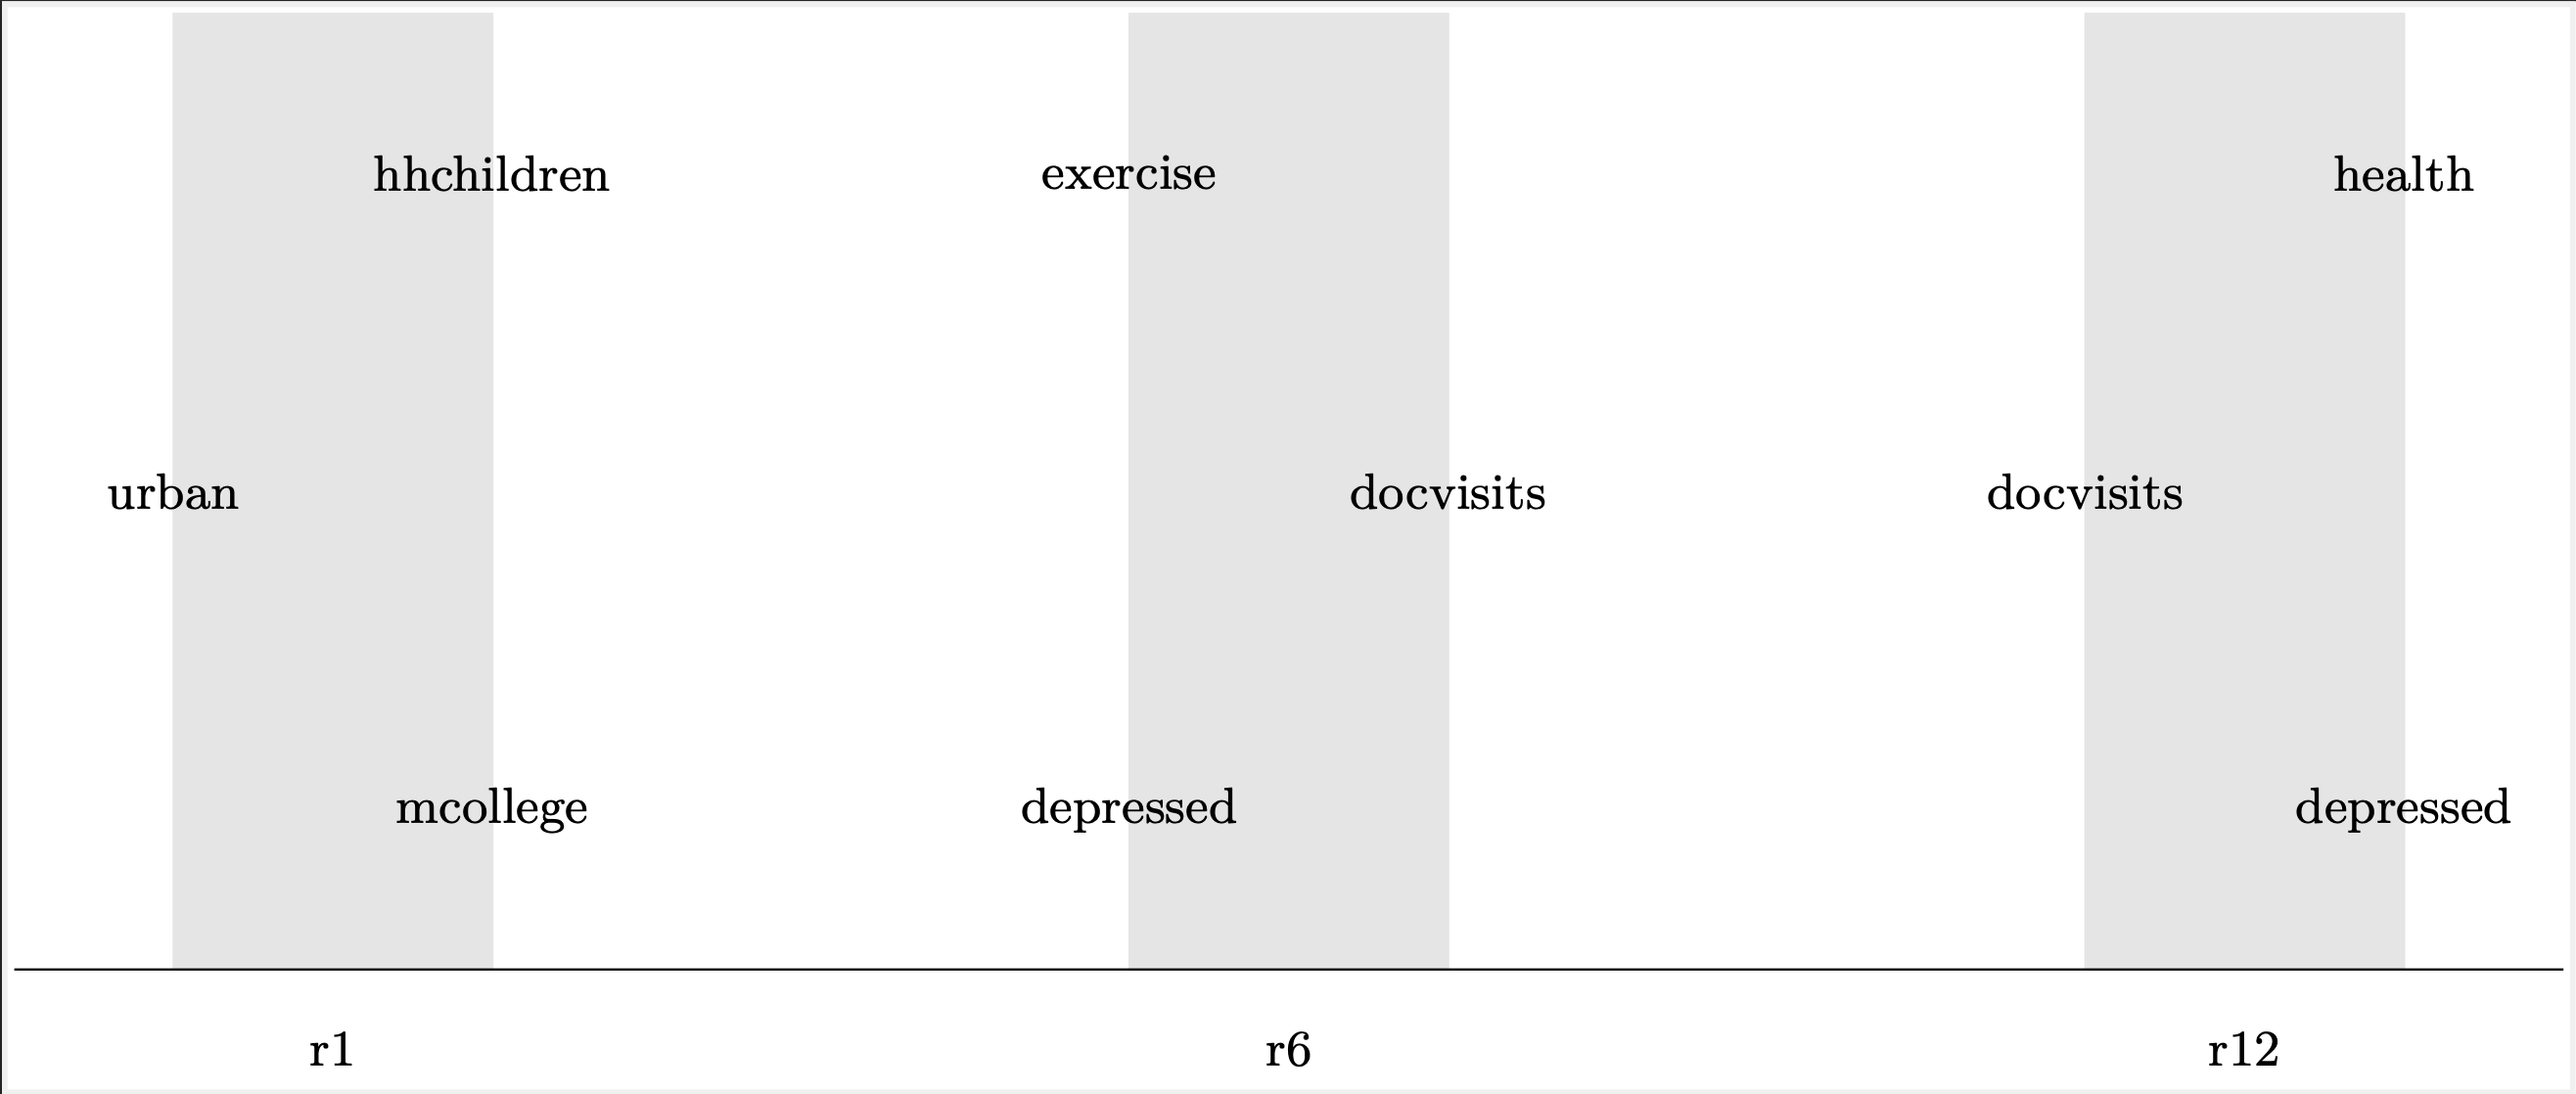
You should - based on your contemplation of the data - construct a DAG to represent the causal relationships among the variables in the dataset. The graph to the right can be used as a template.
The data are a subset obtained from The National Longitudinal Survey of Youth 1997.